
During this tutorial, we will install Stats.d and Graphite on the same server our application is running on. Don't forget that it's best if you monitor your application with graphite & stats.d using another server because that will not be the case in this tutorial.
Requirements :
- A Linux based server (this tutorial will explain the steps for Debian)
- A running Symfony2 application
- StatsDClientBundle
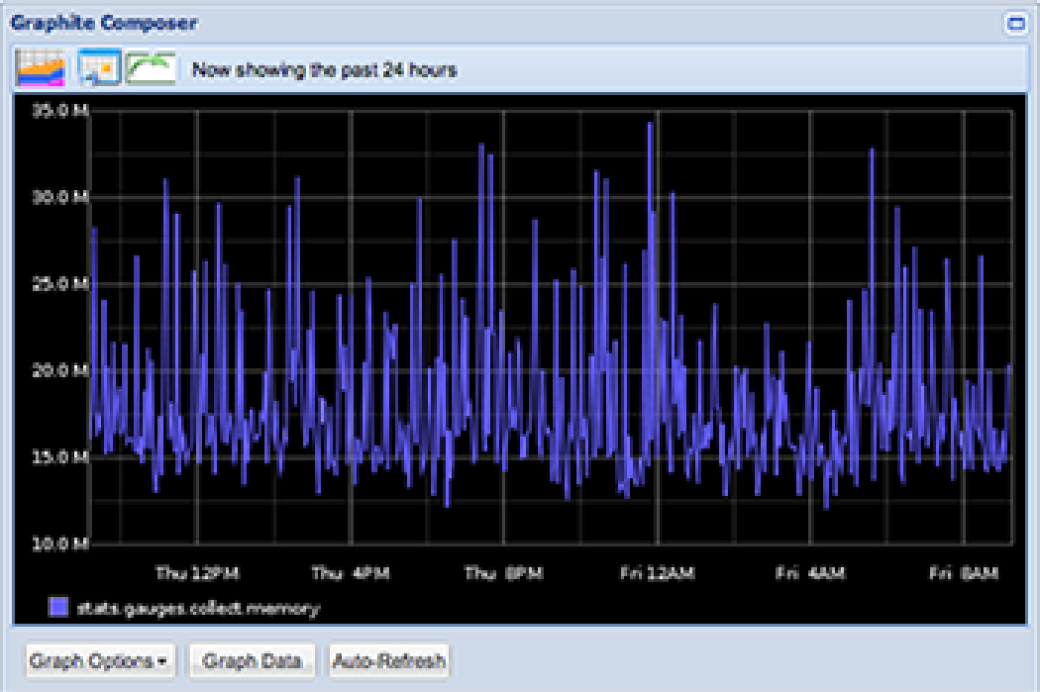
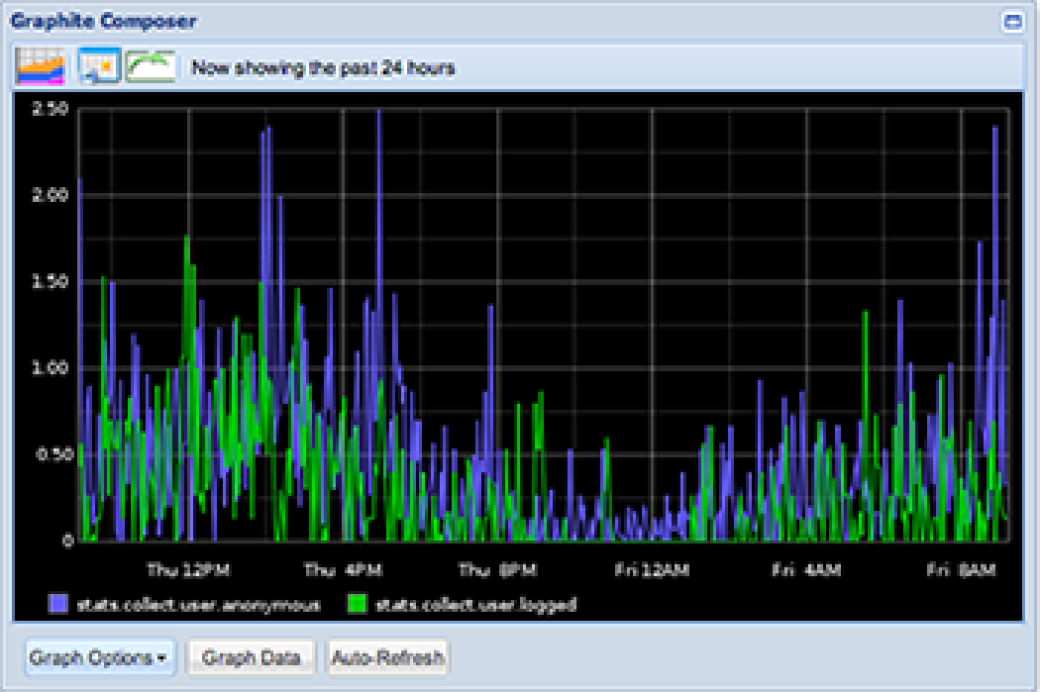
Here's the result we'll have at the end (screenshot from a personal web application) :
Install Graphite
Installing graphite dependencies
apt-get install -y python2.6 python-pip python-cairo python-django python-django-tagging
apt-get install -y libapache2-mod-wsgi python-twisted python-memcache python-pysqlite2 python-simplejson
pip install whisper
pip install carbon
pip install graphite-web

# Setup a vhost by grabbing the example the graphite team released on their repo.
# In this file, you'll provide the url used to access to your Graphite dashboard
wget https://raw.github.com/tmm1/graphite/master/examples/example-graphite-vhost.conf -O /etc/apache2/sites-available/graphite
# If you are running on a Debian, don't forget to replace in the vhost, the WSGISocketPrefix value by the following:
WSGISocketPrefix /var/run/apache2/wsgiConfiguring graphite
cd /opt/graphite/conf/
cp graphite.wsgi.example graphite.wsgi
cp carbon.conf.example carbon.conf
cp storage-schemas.conf.example storage-schemas.conf
# Edit storage-schemas.conf in order to include a custom tweak provided by stats.d
[stats]
pattern = ^stats.*
retentions = 10:2160,60:10080,600:262974
[carbon]
pattern = ^carbon\.
retentions = 60:90d
[default_1min_for_1day]
pattern = .*
retentions = 60s:1d# Create a vi storage-aggregation.conf
vi storage-aggregation.conf# Then copy paste in it the following parameters
[min]
pattern = \.min$
xFilesFactor = 0.1
aggregationMethod = min
[max]
pattern = \.max$
xFilesFactor = 0.1
aggregationMethod = max
[sum]
pattern = \.count$
xFilesFactor = 0
aggregationMethod = sum
[default_average]
pattern = .*
xFilesFactor = 0.3
aggregationMethod = averageLet's go back to the installation process
cd /opt/graphite/webapp/graphite
python manage.py syncdb
chown -R www-data:www-data /opt/graphite/storage/
Enabling graphite host
a2ensite graphite
/opt/graphite/bin/carbon-cache.py start
/etc/init.d/apache2 resta
If you want the full detail on the graphite, take a look at the source I used for the installations steps.
Stat.dInstall
sudo apt-get update && apt-get install git-core curl build-essential openssl libssl-dev

# Don't forget to go to the location you want to install node in (like cd /home/) before running these commands
git clone https://github.com/joyent/node.git
cd node
git checkout v0.8.12

./configure --openssl-libpath=/usr/lib/ssl
make
make test
sudo make install
node -v
npm -v

cd ..
git clone https://github.com/etsy/statsd
cd statsd
cp exampleConfig.js local.js
Edit local.js and make it looks like:
{
graphitePort: 2003
, graphiteHost: "localhost"
, port: 8125
}
Then you need to run stats.d
apt-get install screen
screen node stats.js local.js

# Then press Ctrl + a + d in order to let run stats.js in background mode thanks to screen.
If you want the full detail, check out the source.
Graphite and Stat.d client.From now on, we have a running copy of both
You can access it with the URL you provided in your vhost
Now, let's install the StatsDClientBundle in order to monitor our Symfony2 application
// composer.json
"require": {
    # ..
    "liuggio/statsd-client-bundle": ">=1.2",
    # ..
}
// After running php composer.phar update liuggio/statsd-client-bundle
// Enable the Bundle in AppKernel.php
<?php
class AppKernel extends Kernel
{
public function registerBundles()
{
$bundles = array(
// ...
new Liuggio\StatsDClientBundle\LiuggioStatsDClientBundle(),
// ...
// Then add the full configuration for the Bundle in app/config/config.ymlliuggio_stats_d_client:
connection:
host: localhost
port: 8125
fail_silently: true
enable_collector: true #default is false
collectors:
liuggio_stats_d_client.collector.dbal: 'collect.query'
liuggio_stats_d_client.collector.visitor: 'collect.visitor'
liuggio_stats_d_client.collector.memory: 'collect.memory'
liuggio_stats_d_client.collector.user: 'collect.user'
liuggio_stats_d_client.collector.exception: 'collect.exception'Note that we added the full configuration for the bundle which allow us to collect these usefull information such as logged users vs anonymous, memory usage.
In the 2nd part, we'll see how to monitor custom events in your Symfony2 app.