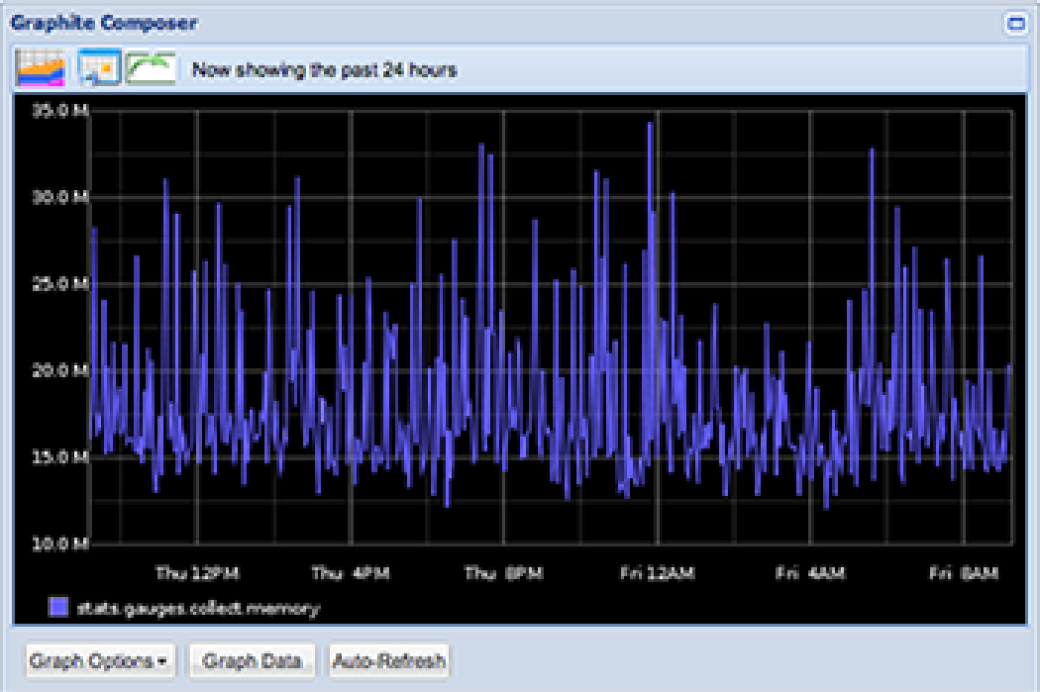
Few times ago, I wrote two articles on how to monitor your Symfony2 application via Stats.d and Graphite (part 1 / part 2).
Although I specifically said that you should be running your graphite environment on another server, I choose not to follow my own advise (« do what I say not what I do »).
This mini article purpose is to give you some feedback about running your monitoring system on the same server that you monitor. Long story short : DON'T.
My server is an Intel Xeon 4 Core (4 x 2,4 Ghz) 8 Go DDR3 2 x with 500 Go SATA Raid 1 Hard.
Running graphite + carbon + stats.d on my production server was eating up to 95% i/o disk utilisation resulting in slow response time for my webserver, slow operations which required disk usage...
Once I realized that my monitoring system was the problem (especially carbon), I decided to shut it down. The difference was clearly visible. From 95% I/O disk usage to 0-1%.
I won ~60% on my server response time (both monitored by google analytics and newrelic).
